Troubleshooting
IDE packages add more features to Pulsar, but they also introduce new possible points of failure. Here are a few techniques you can use to diagnose these failures.
How do I figure out why something isn’t working?
IDE packages tend not to have interfaces, so troubleshooting can sometimes be tricky. The README file of the specific IDE package is the best place to start. Ideally, it should have:
- The name of the underlying language server and a link to its own documentation
- Information about the configuration options available for that package
How failures happen
Here are a few things that could be going wrong:
-
As stated earlier, some language servers will have dependencies that are not included in the package itself. Re-read the documentation and make sure you’ve got everything installed that you need to, and that your IDE package can see whatever you’ve installed (in other words, make sure any new binaries you installed are in your
PATH). -
Sometimes a language server requires extra amounts of hand-holding or configuration. For instance, the
clangdlanguage server that powers pulsar-ide-clangd (for C/C++) wants to find a file calledcompile_commands.jsonsomewhere within your project; this file is typically generated by your build system.Similarly, a language server might be a thin wrapper around other tools with their own conventions. One example is python’s
pylsp; some of its features are enabled by default, but others require opt-in via configuration. If it feels like your IDE package isn’t providing as many features as it seems like it should, this may be one reason why. -
Some IDE packages (especially older ones designed for Atom) may not be keeping up with their underlying language servers, and may be advertising fewer features than those language servers can support. If an IDE package hasn’t been updated in a while and you think it’s not being actively maintained, ask about it in one of our communities and we’ll take a look; it might just need a version bump or some new metadata!
Using symbols-view as a guinea pig
Most language servers support symbol resolution, so the built-in symbols-view package has some tools that can often help you diagnose whether your language server is working properly.
For instance: invoking a command called Symbols View: Show Active Providers will display a notification with a list of all known symbol providers, along with the packages that provide them.
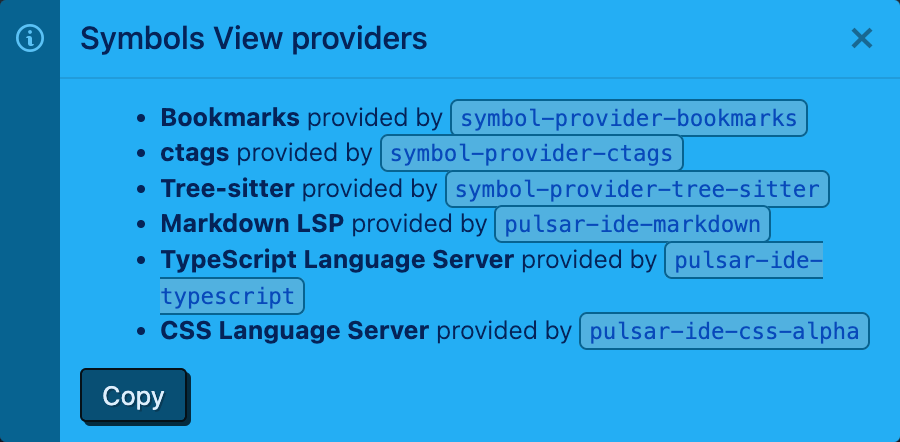
Two of these providers, ctags and Tree-sitter, are built into Pulsar. The others in the list are provided by community packages and IDE packages in particular. If you don’t see your IDE package in this list, there’s a good chance it’s failing to start properly; read below.
If your package is listed in the notification, you can go to the symbols-view settings and select the Show Provider Names In Symbols View setting. This will add a badge onto palette items in symbols lists that shows the source of the symbol.
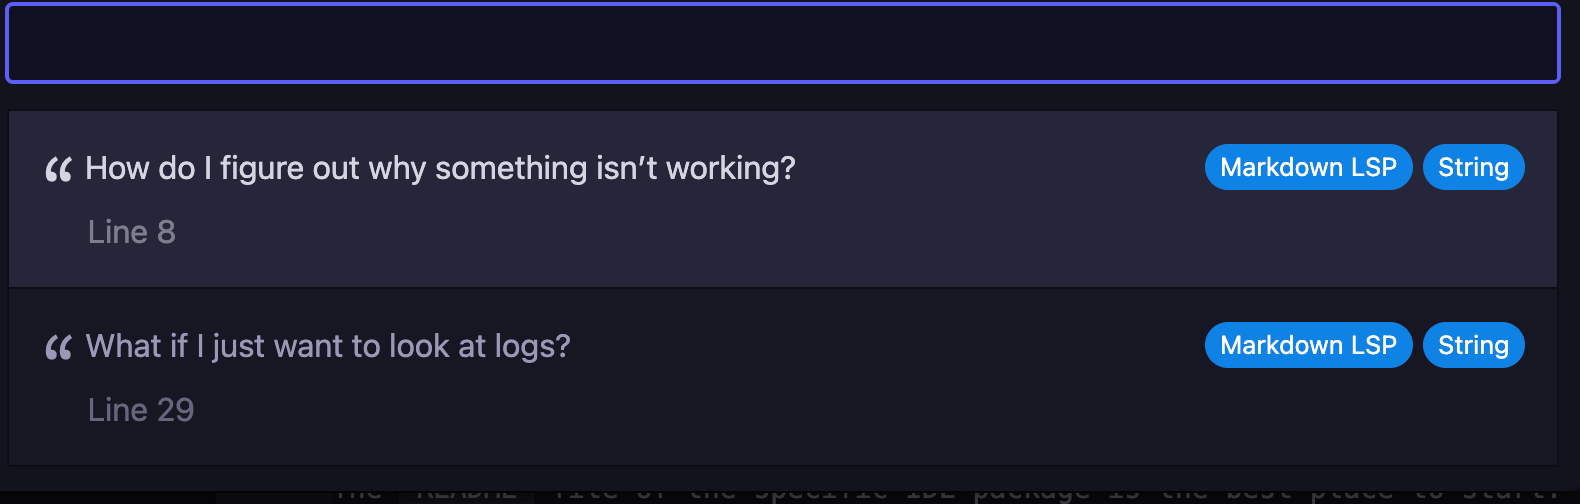
If an IDE package is providing symbols, it’s typically regarded as a better source of information than the built-in symbol providers. So if it’s working properly, you should expect it to “win” over such providers.
What if I just want to look at logs?
You should open your developer tools and look through the console for any errors related to your package. If the package fails to activate, there will typically be a message indicating it.
If the package seems to activate properly — for instance, if you can view its package settings page — then the underlying language server is probably failing to start up. Language servers launch in a separate process from Pulsar; if that launch process fails for whatever reason, the “brain” of the IDE package will be absent.
Luckily, all IDE packages based on atom-languageclient have a hidden logging mode. You can enable it by opening your developer tools, focusing the Console tab, and executing this JavaScript:
atom.config.set('core.debugLSP', true);Once you change this setting, reload your window via the Window: Reload command. Open developer tools again and you should see some new log lines. Each language-server–related log message should be annotated with the name of the server, and you should even be able to filter on that name to look at the output from one specific IDE package:
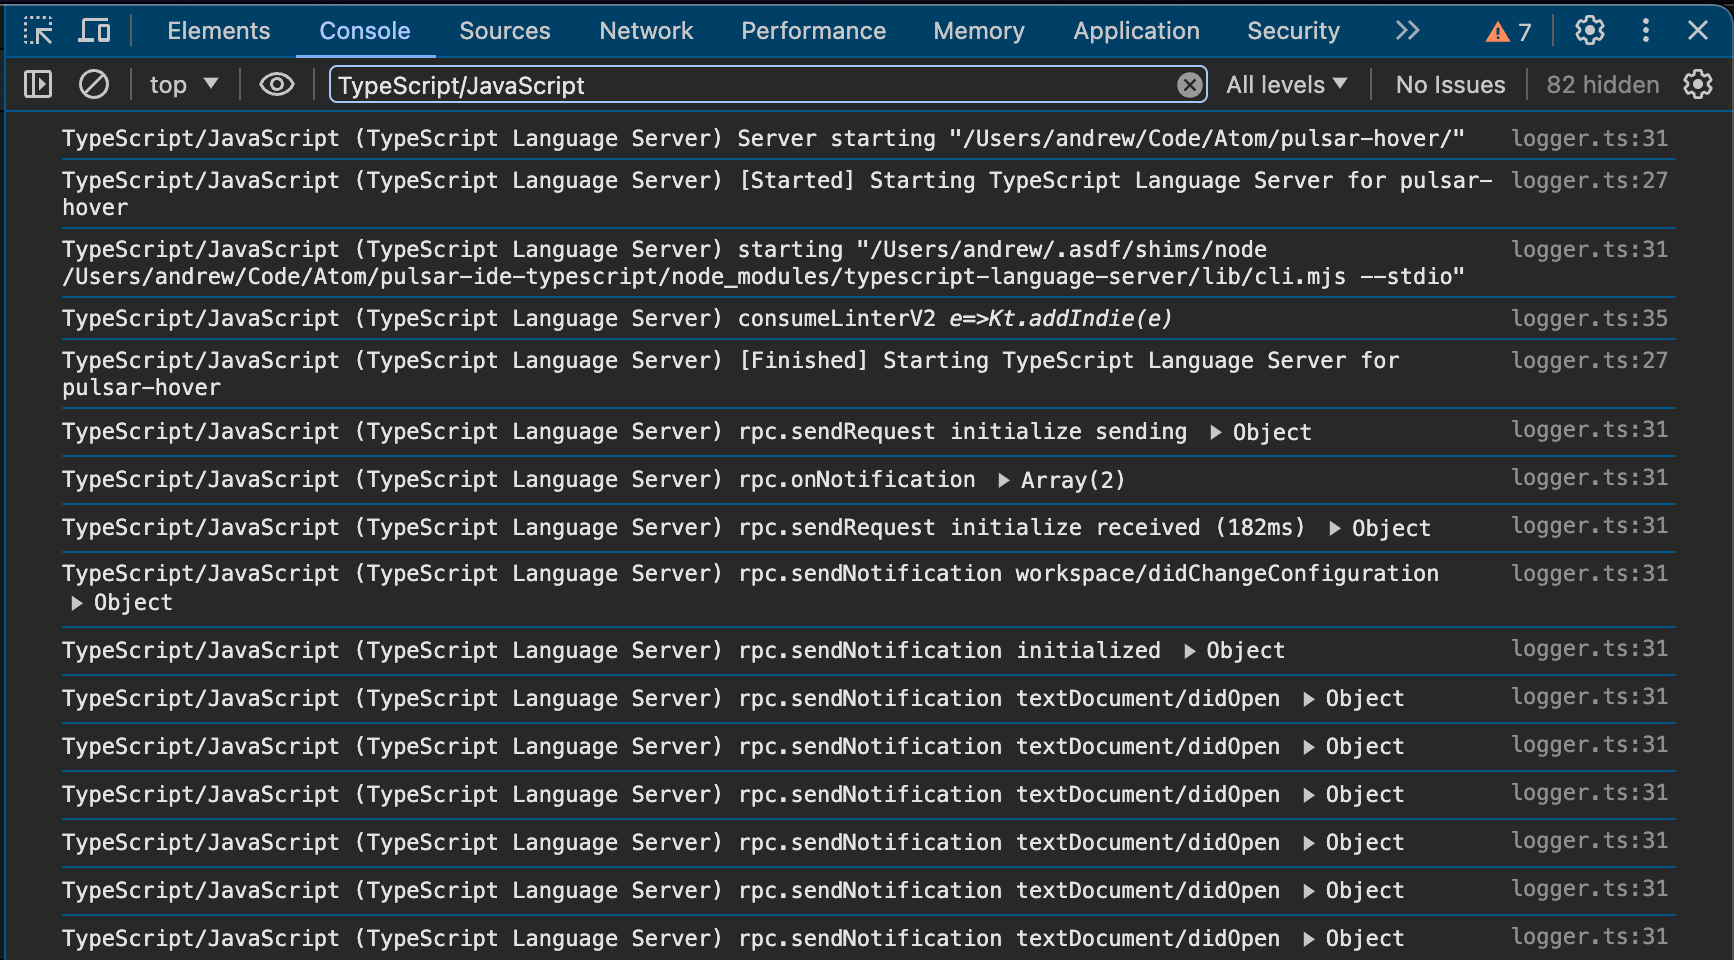
Here you can see all the ways that the IDE package (the language client) is communicating with the language server. If something is going wrong during startup, this logging should make it easier to identify the root cause.
When you’re done drinking from the firehose, you can disable the debug logging and reload your window once again:
atom.config.set('core.debugLSP', false);