Diagnosing runtime performance
If you’re experiencing performance problems in a particular situation, your issue reports will be more valuable if you include a saved profile from Chrome’s CPU profiler that gives some insight into what is slow.
To run a profile, open the Developer Tools with Ctrl+Shift+IAlt+Cmd+I. From there:
- Click the Profiles tab
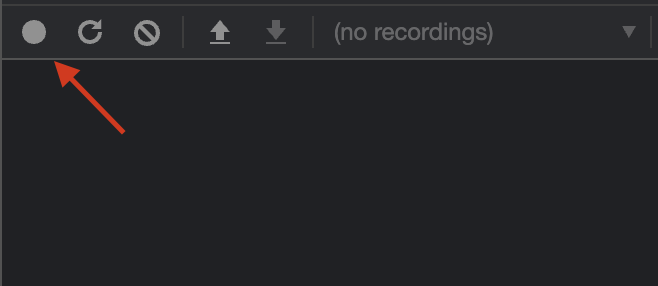
- Click the “Record” button in the toolbar (see screenshot below)
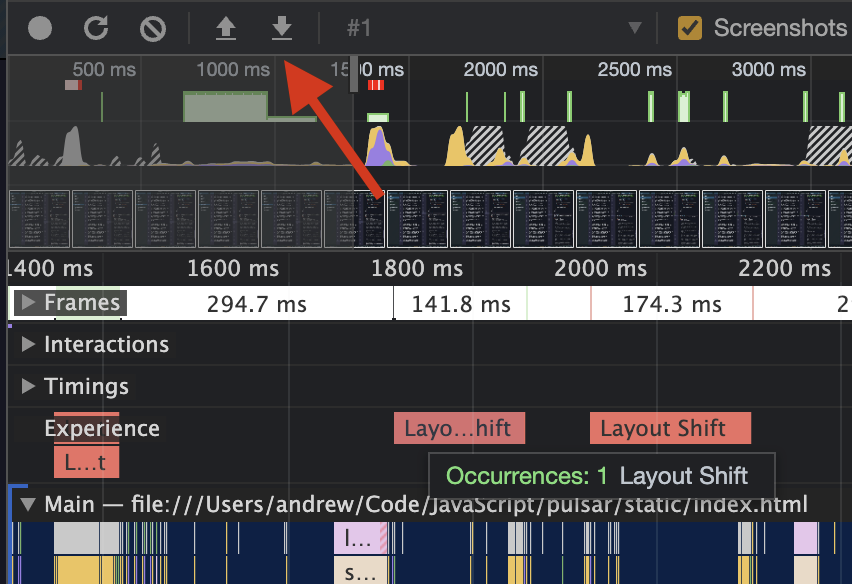
Once the profile starts collecting data, perform the slow action to capture it in the performance profile. When finished, click “Stop.” After some processing, a graph of the recorded actions will appear. You can save and post the profile data by clicking the ”Save” icon in the toolbar.
To learn more, check out the Chrome documentation on the Performance tab.